
Working with layouts in Primavera P6?
- Mech Surge

- Jun 14, 2020
- 2 min read
Updated: Aug 2, 2020
You can create layouts that show the info and format you would like. Customize the top and bottom areas of the layout to include tables, graphs, charts, Activity or Project Details, and more.
ACTIVITY TABLE
Display activities in column format. Use this type of layout to quickly update a project.
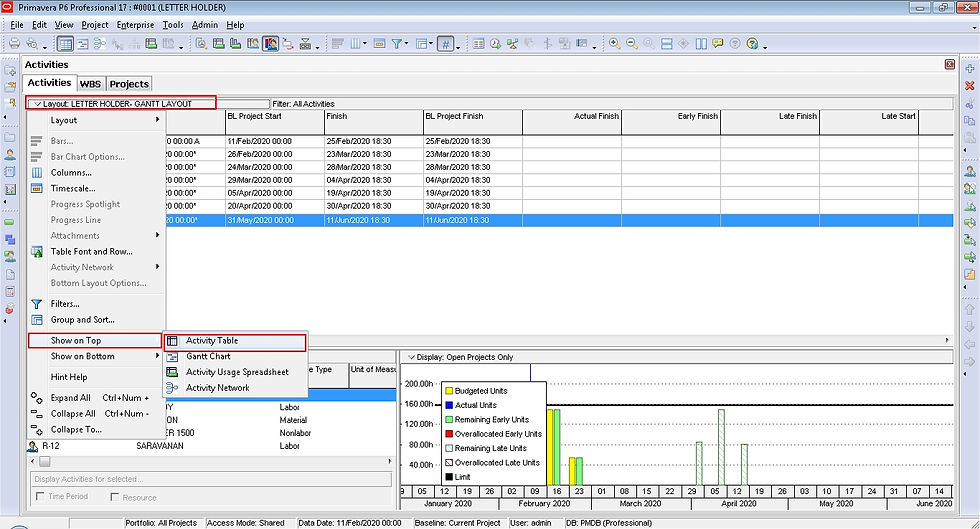
GANTT CHART
Provide a graphical show of activity progress over the course of the project. Use this layout to review or analyze the schedule.

ACTIVITY USAGE SPREADSHEET
Display units, costs, or earned value data by activity over time. Use this type of layout to review per period and rolled up activity resource/cost data.

ACTIVITY NETWORK
Provide a graphical show of activities, as well as logical relationships. Activity Network are often displayed in the top layout only. The left side of this example displays the WBS hierarchy, while the right side shows the activity flow in graphical format. Use this layout to alter the sequence of activities as your project evolves.

ACTIVITY DETAILS
Displays and enables you to modify detailed info for an activity you choose in either the Activity Table or Activity Network. These types of layout are often displayed in the bottom layout only. Use this layout type to add and update activities.

RESOURCE USAGE SPREADSHEET
Display resource data in spreadsheet format. These spreadsheets are often displayed in the bottom layout only. Use this layout type to view resource allocation over time, according to a timescale you specify.

ACTIVITY USAGE PROFILE
Display a time distribution of activity units and prices in a Bar Chart format. This profile are often displayed in the bottom layout only. Use this layout type to review the labor use for activities in a specific time-period.

RESOURCE USAGE PROFILE
Display a time distribution of resource units and prices in relation to activities in a Bar Chart format. This profile are often displayed in the bottom layout only. Use this layout type to analyze resource levels with the schedule.

TRACE LOGIC
Provides a graphical show of dependency relationships for an activity you select in either the Activity Table or Activity Network. Trace Logic can be displayed in the bottom layout only. Use this layout type to easily move forward and backward through the plan to view the critical path.

NO BOTTOM LAYOUT

ADD NEW LAYOUT
Customize the top and bottom layouts to create a new layout, and then save the layout using a name you specify.
STEP:- LAYOUT OPTION BAR--->LAYOUT--->OPEN-->ENTER “LAYOUT NAME”--->SAVE

EXPORT LAYOUT
STEP:- LAYOUT OPTION BAR-->LAYOUT-->OPEN--->SELECT “LAYOUT”--->EXPORT

IMPORT LAYOUT
STEP:- LAYOUT OPTION BAR--->LAYOUT--->OPEN--->IMPORT

Watch Video


Comments